How to Use Technical Analysis to Enhance Your Trades
In the fast-paced world of trading, understanding the market’s language can make a significant difference in your success. Technical analysis, a method of evaluating securities by analyzing statistics generated by market activity, such as past prices and volume, can be the key to unlocking insights that might not be immediately apparent.
What is Technical Analysis?
Technical analysis is a trading discipline employed to evaluate investments and identify trading opportunities by analyzing statistical trends gathered from trading activity. Unlike fundamental analysis, which attempts to measure a security’s intrinsic value, technical analysis focuses on patterns of price movements, trading signals, and various charting tools to gauge the market’s strength or direction.
One of the foundational principles of technical analysis is that all known information is already reflected in the price of a security. Therefore, rather than concentrating on the intrinsic value, technical analysts believe that past trading activity and price changes of a security can be valuable indicators of the security’s future price movements.
Chart Types: The Canvas of the Market
To get started with technical analysis, understanding the different types of charts is crucial. Here are the most common ones:
- Line Charts: Often the first step for beginners, line charts offer a simple depiction of price movements over a specific period. By connecting the closing prices of an asset, they provide a clear and straightforward view of the overall trends.
- Bar Charts: These charts give more information than line charts, showing the opening, closing, high, and low prices of a security for each period. This helps traders see the price range for a given trading session.
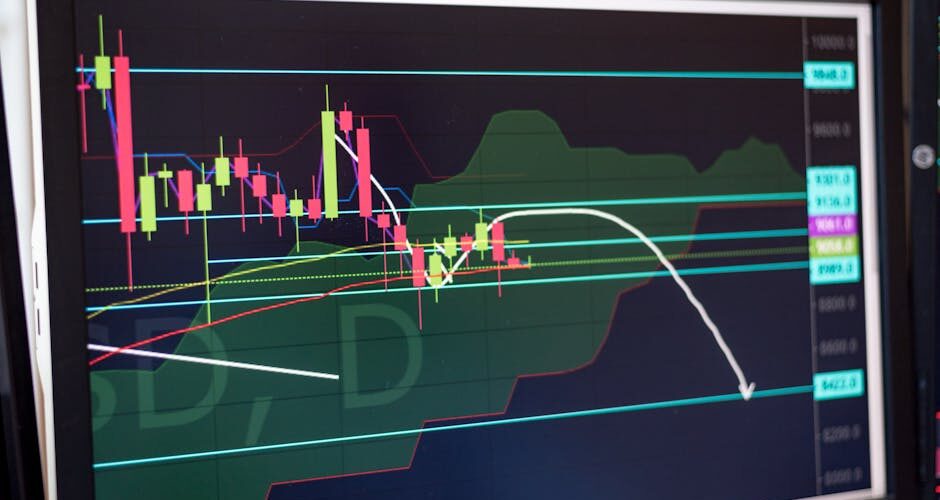
- Candlestick Charts: A favorite among traders, candlestick charts provide the same data as bar charts but in a more visual format. Originating from Japan in the 18th century, they offer patterns such as ‘Doji’ or ‘Hammer’, which can be indicative of market sentiment.
Technical Indicators: The Trader’s Toolbox
Technical indicators are mathematical calculations based on the price, volume, or open interest of a security or contract. They are used to predict future price movements in the market. Here are some popular indicators:
- Moving Averages: This indicator smooths out price data by creating a constantly updated average price. Traders often use the 50-day and 200-day moving averages to identify the long-term trends.
- Relative Strength Index (RSI): RSI measures the speed and change of price movements, oscillating between 0 and 100. An RSI above 70 indicates that a security is overbought, while below 30 suggests it might be oversold.
- MACD (Moving Average Convergence Divergence): This momentum indicator shows the relationship between two moving averages of a security’s price. It’s useful for identifying potential buy and sell points.
Recognizing Patterns: The Market’s Footprints
One of the main focuses of technical analysis is identifying patterns that might indicate future price movements. Here are a few classic patterns:
- Head and Shoulders: This pattern is used to predict a bullish-to-bearish reversal. It’s characterized by a peak (shoulder), followed by a higher peak (head), and then another lower peak (shoulder).
- Triangles: These are continuation patterns that can signal either a bullish or bearish market depending on their direction. Ascending triangles are bullish, while descending triangles are bearish.
- Double Tops and Bottoms: These are reversal patterns. A double top is a bearish reversal pattern, while a double bottom indicates a bullish reversal.
The Role of Volume in Technical Analysis
Volume is a crucial component of technical analysis, as it provides insights into the strength of a price move. High volume indicates strong interest and a higher likelihood of continuing the trend, whereas low volume might suggest a lack of interest and weaker trends. For example, if a stock breaks through a resistance level on high volume, it might indicate a strong bullish trend.
Consider the historical case of Tesla, which in early 2024 saw a major breakout above a key resistance level with unusually high volume. This signal led to a significant rally in its stock price, demonstrating the power of volume in confirming trends.
Applying Technical Analysis: Practical Tips
It’s all about practice when it comes to implementing technical analysis effectively in your trading strategy. Here are some tips to get you started:
- Start Simple: Choose a few indicators to follow initially rather than overwhelming yourself with too many at once. As you become more comfortable, you can add more tools to your arsenal.
- Backtest Your Strategies: Use historical data to backtest your strategies. This helps you understand how they would have performed in the past and fine-tune them for future use.
- Keep a Trading Journal: Document your trades, the indicators you used, and your reasoning. This will help you learn from your mistakes and refine your strategies over time.
Remember, technical analysis is not a crystal ball. It’s a tool that, when used effectively, can provide you with valuable insights to enhance your trading decisions. As you refine your skills, you’ll be better equipped to navigate the complexities of the markets and make more informed trading decisions.